Sales performance report
Sample template with illustrative sales data. This is a static preview, not customer work or a recorded Cue execution.
1. Sales Performance Report

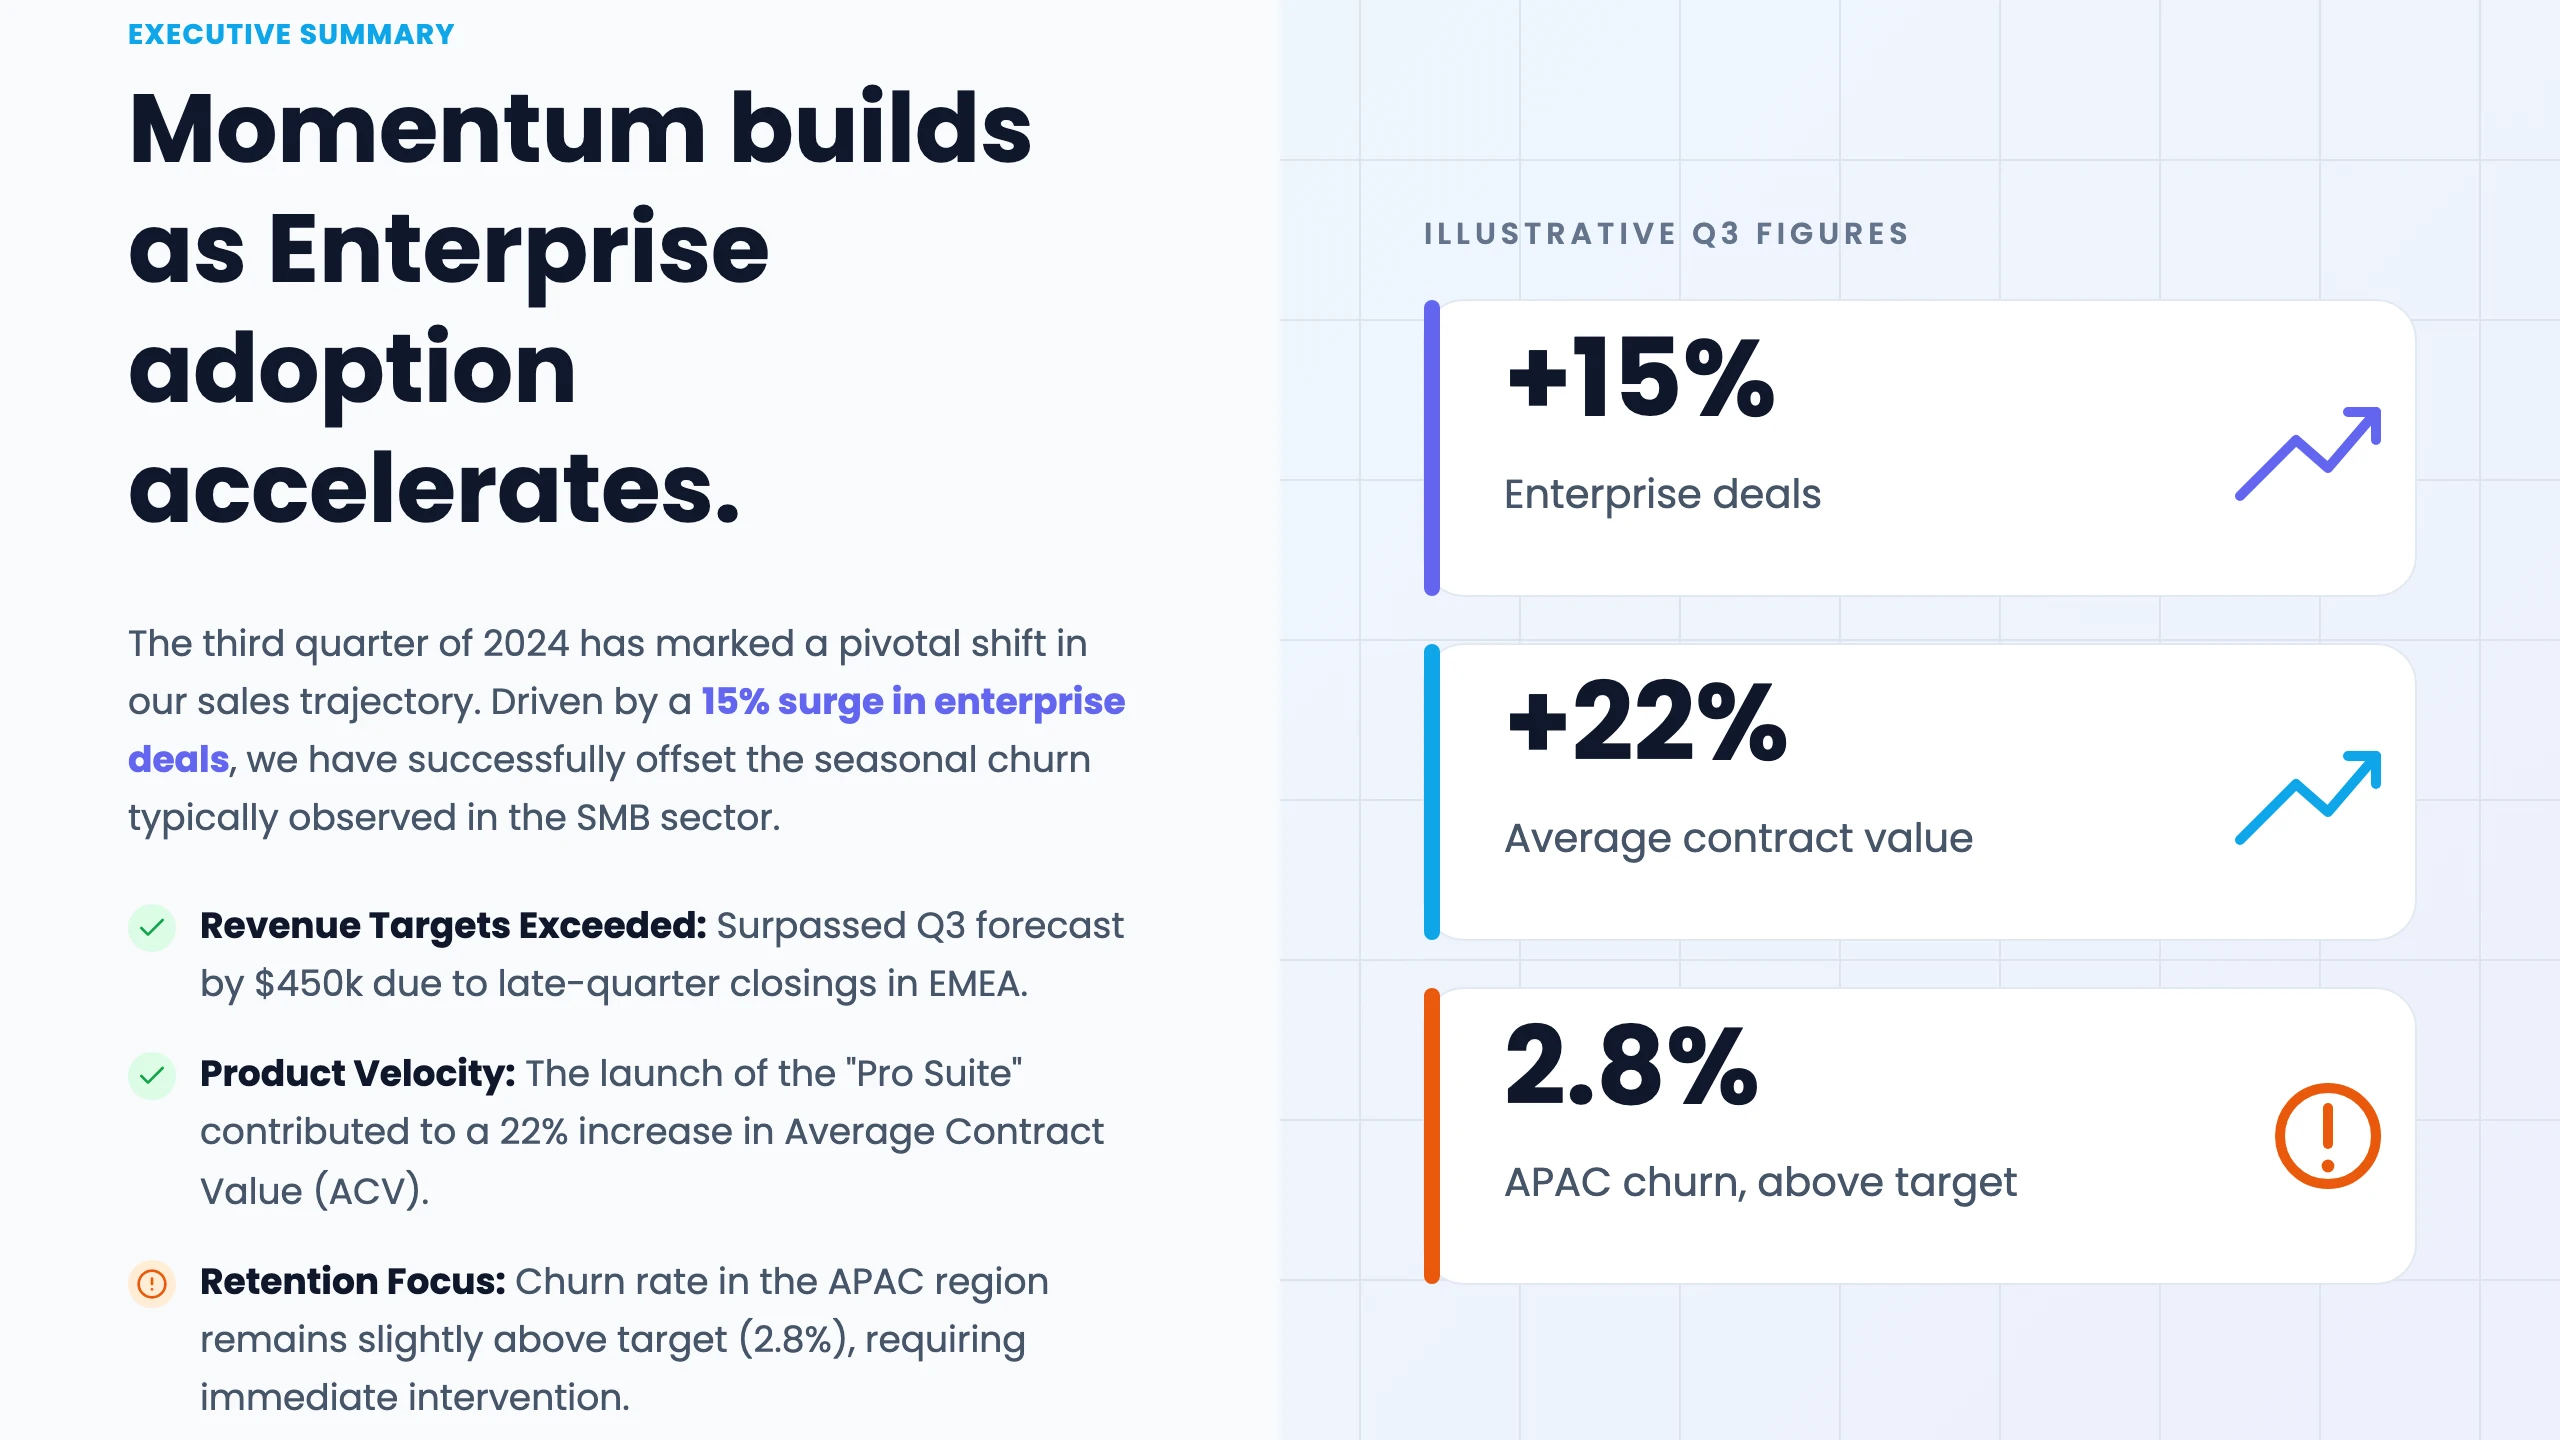
2. Executive Summary
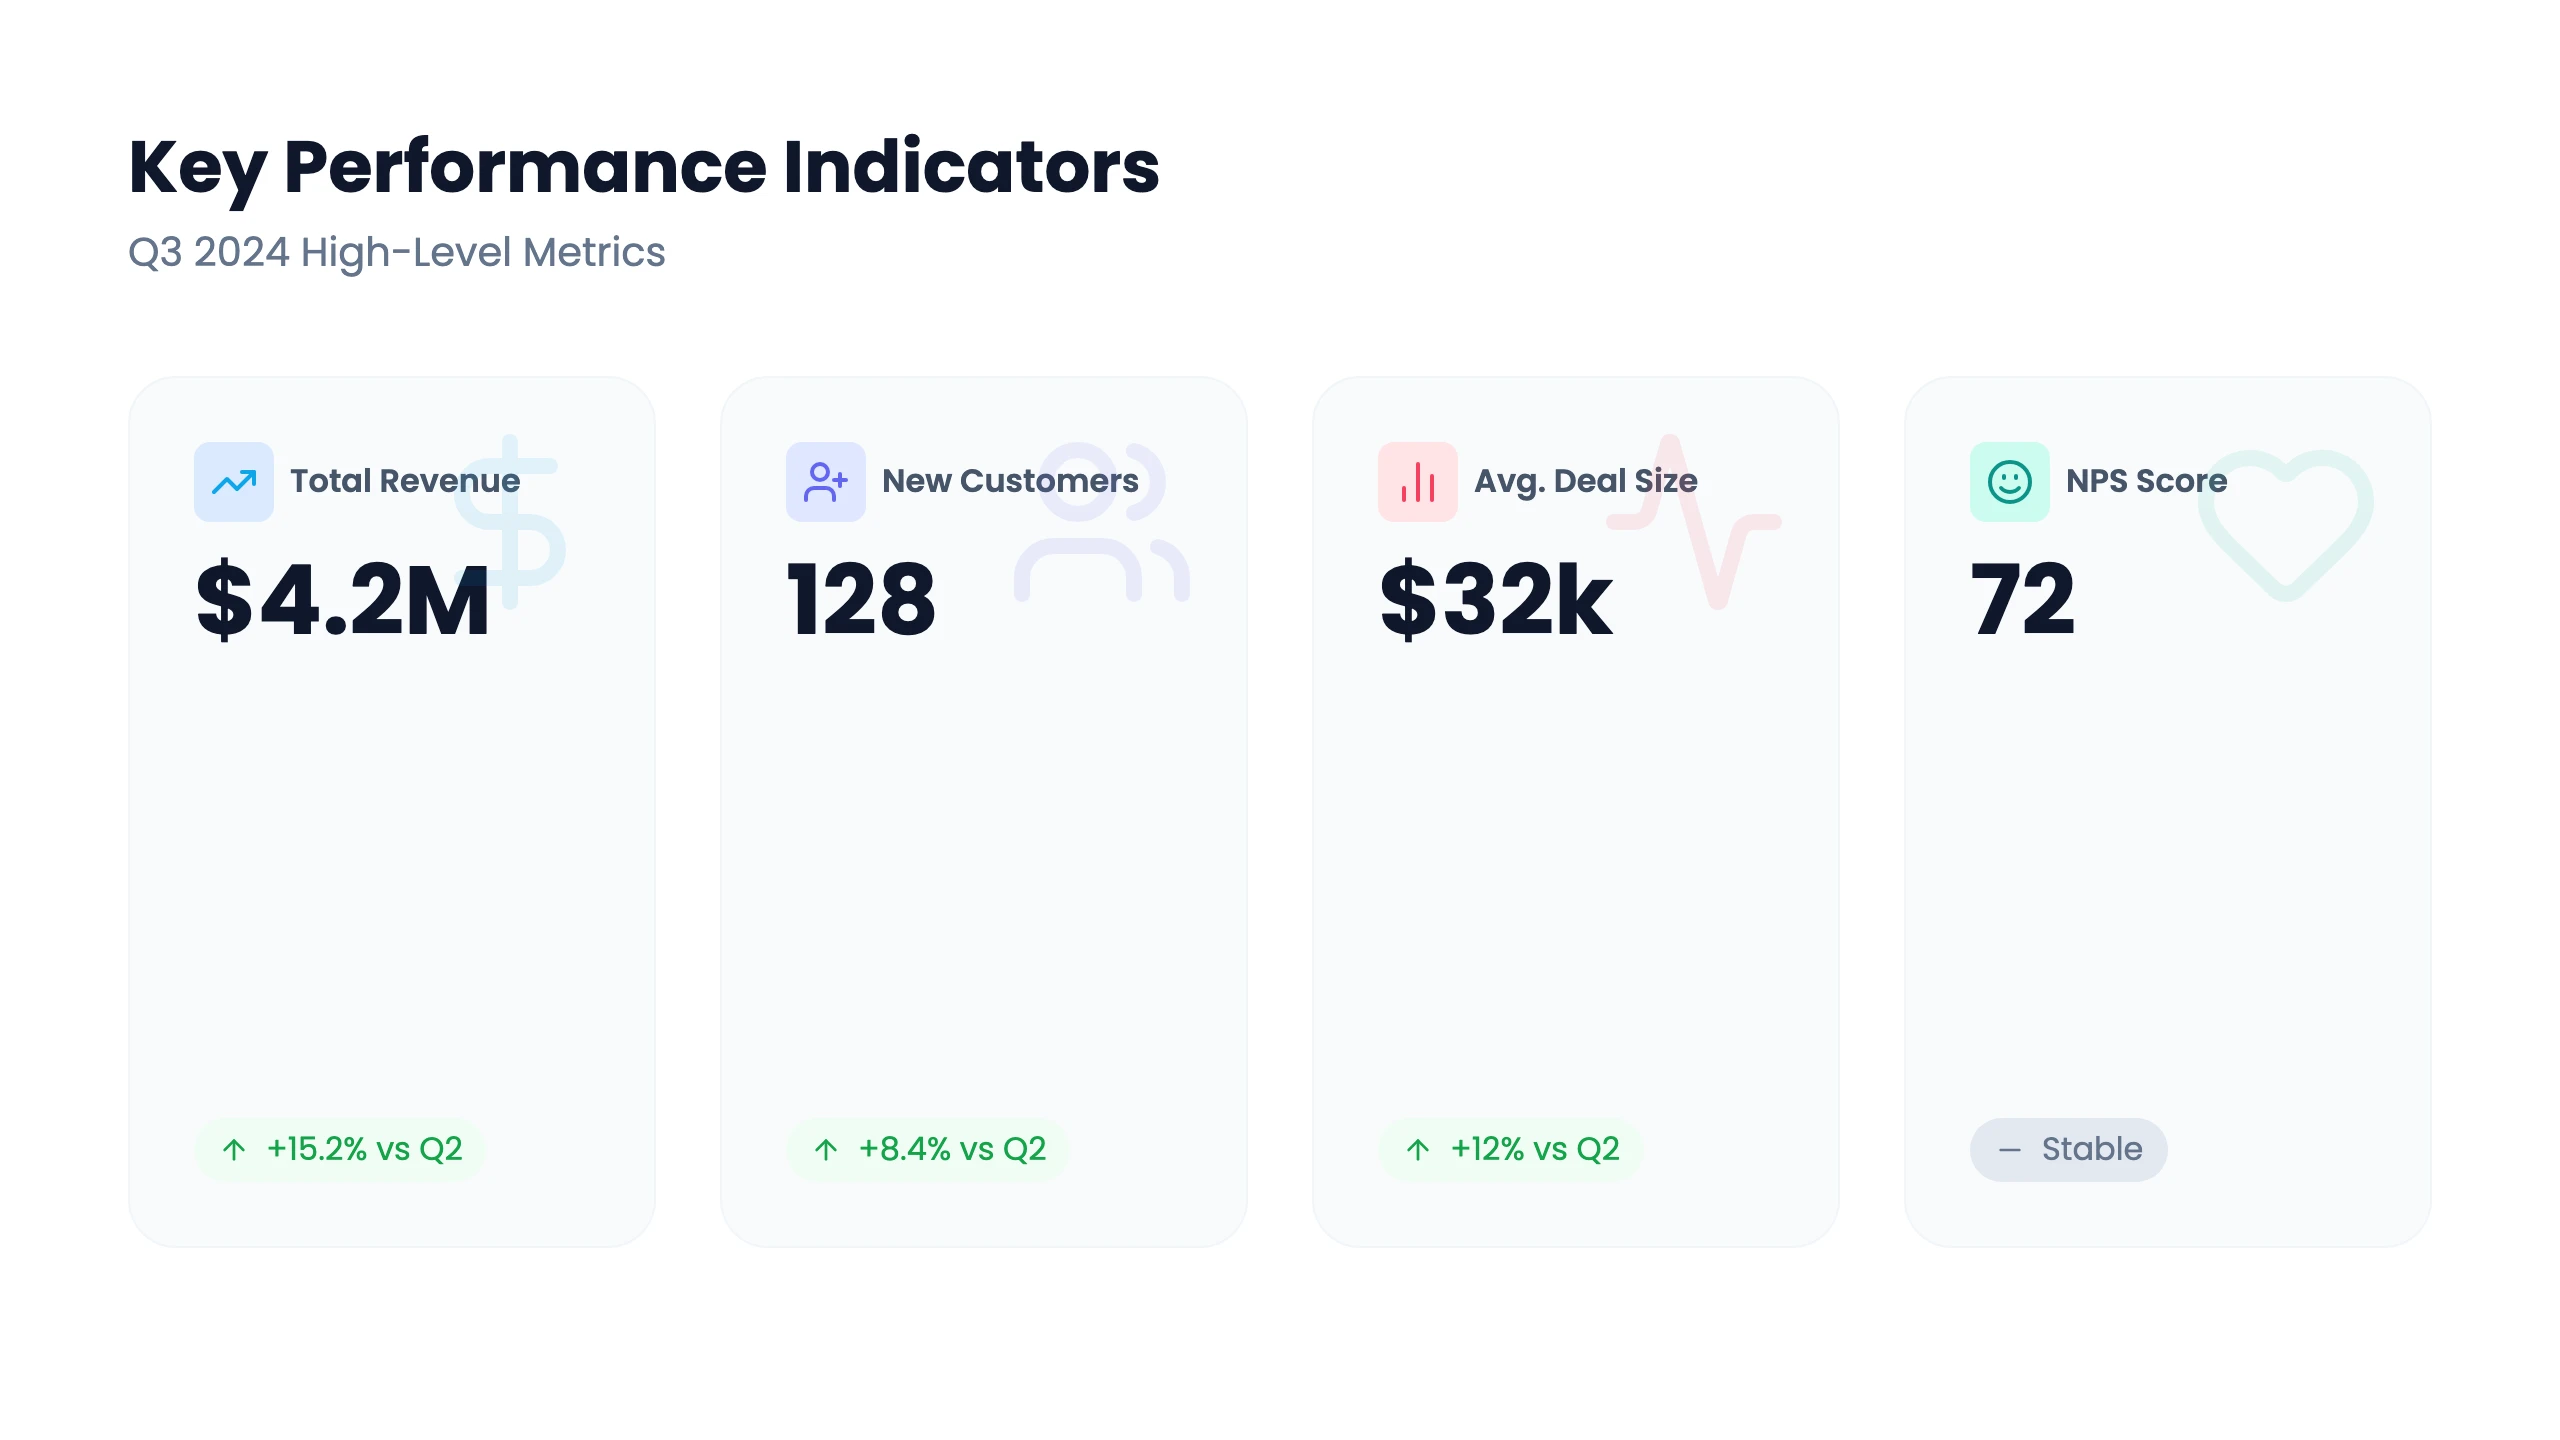
3. Key Performance Indicators
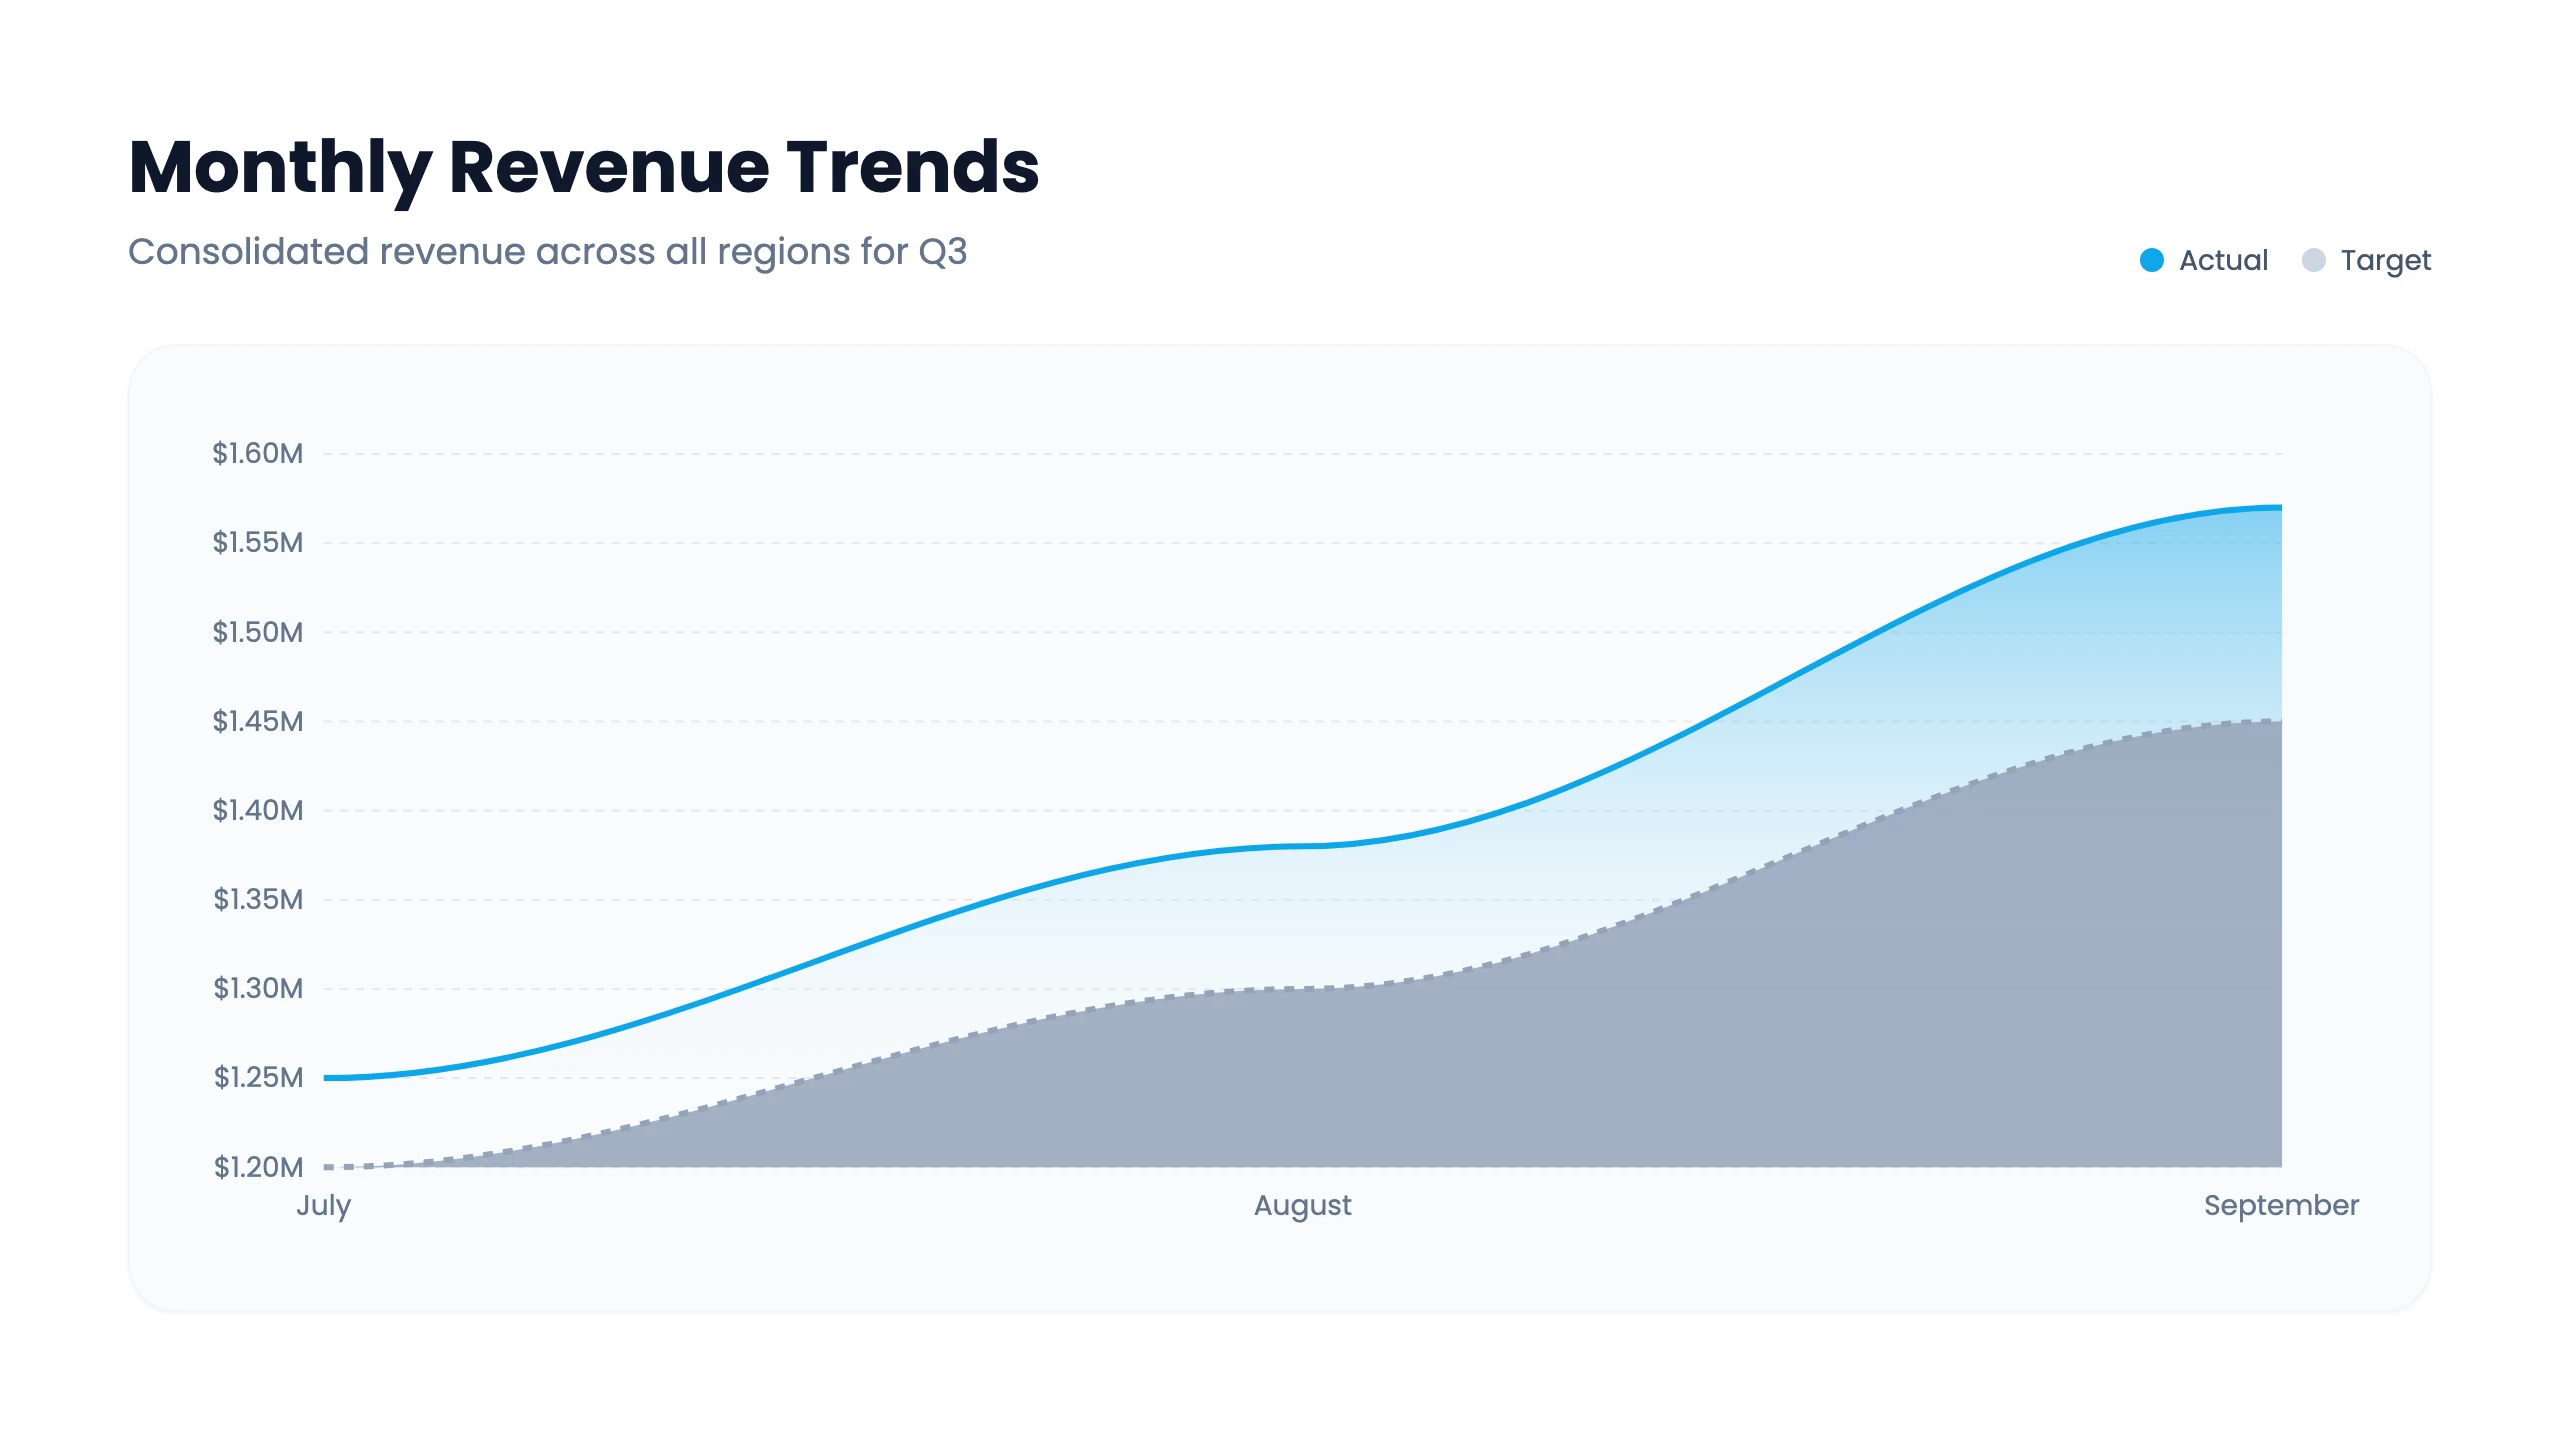
4. Revenue Trends
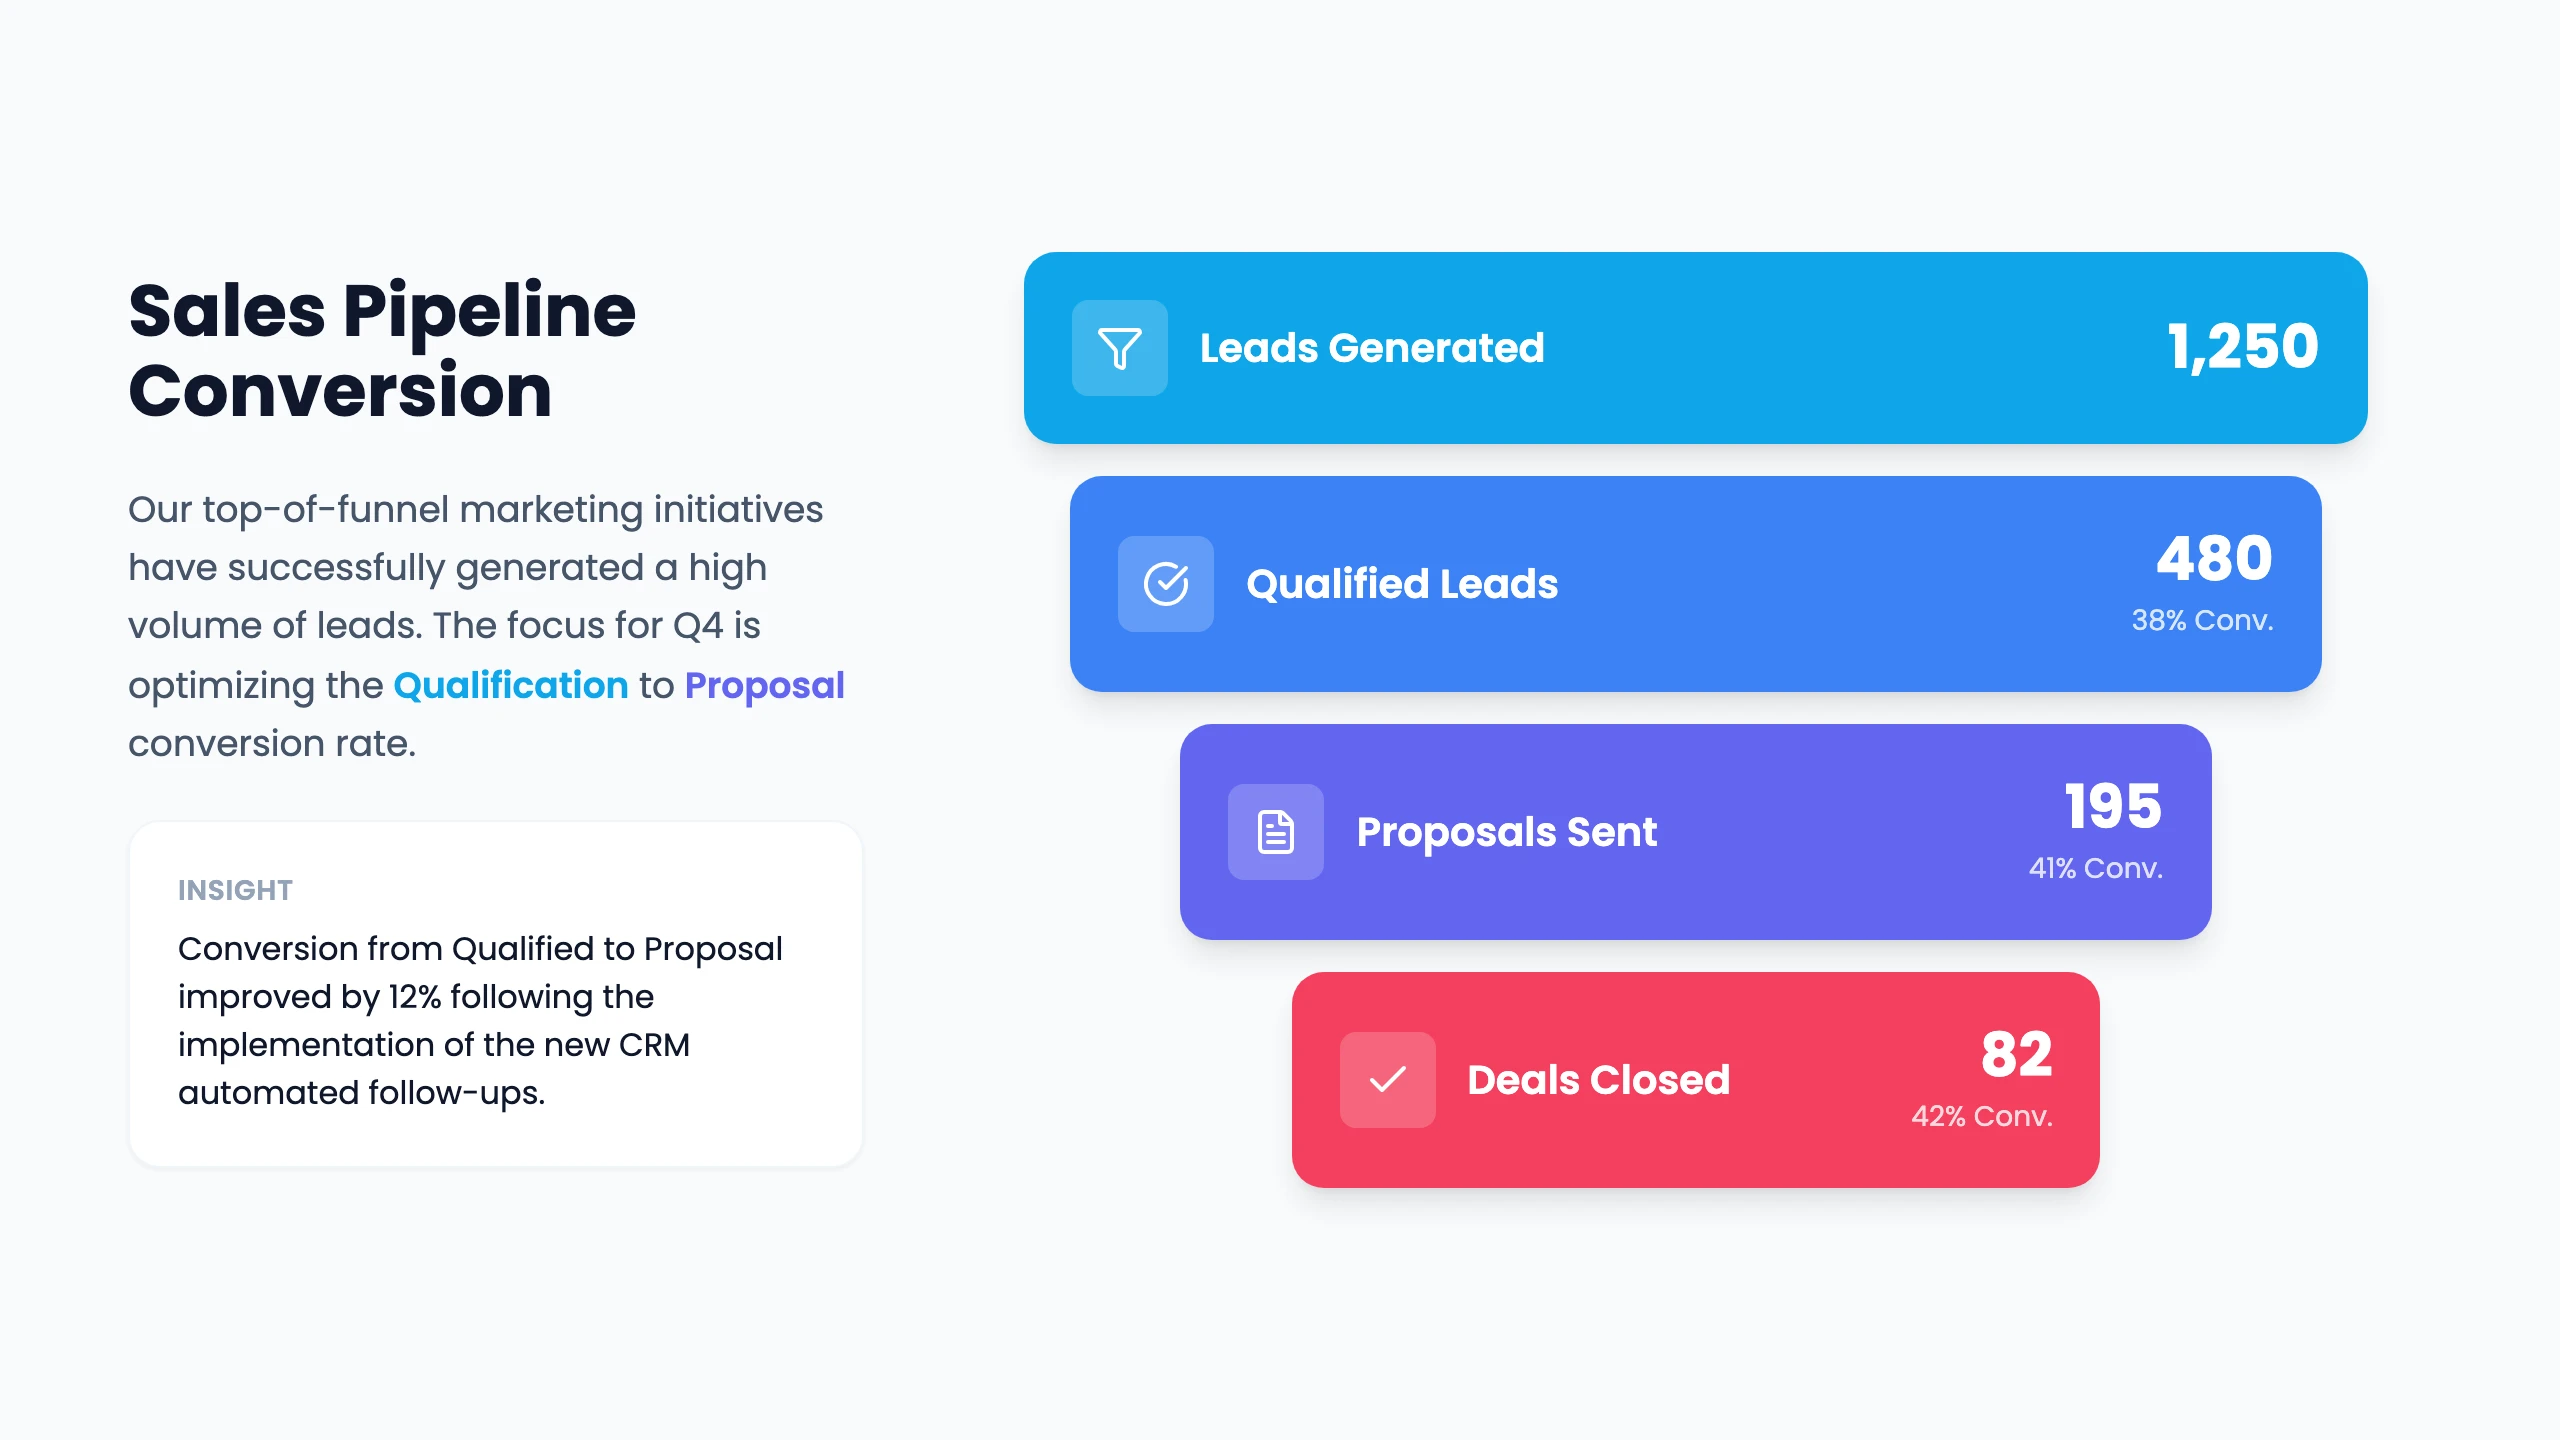
5. Sales Activity
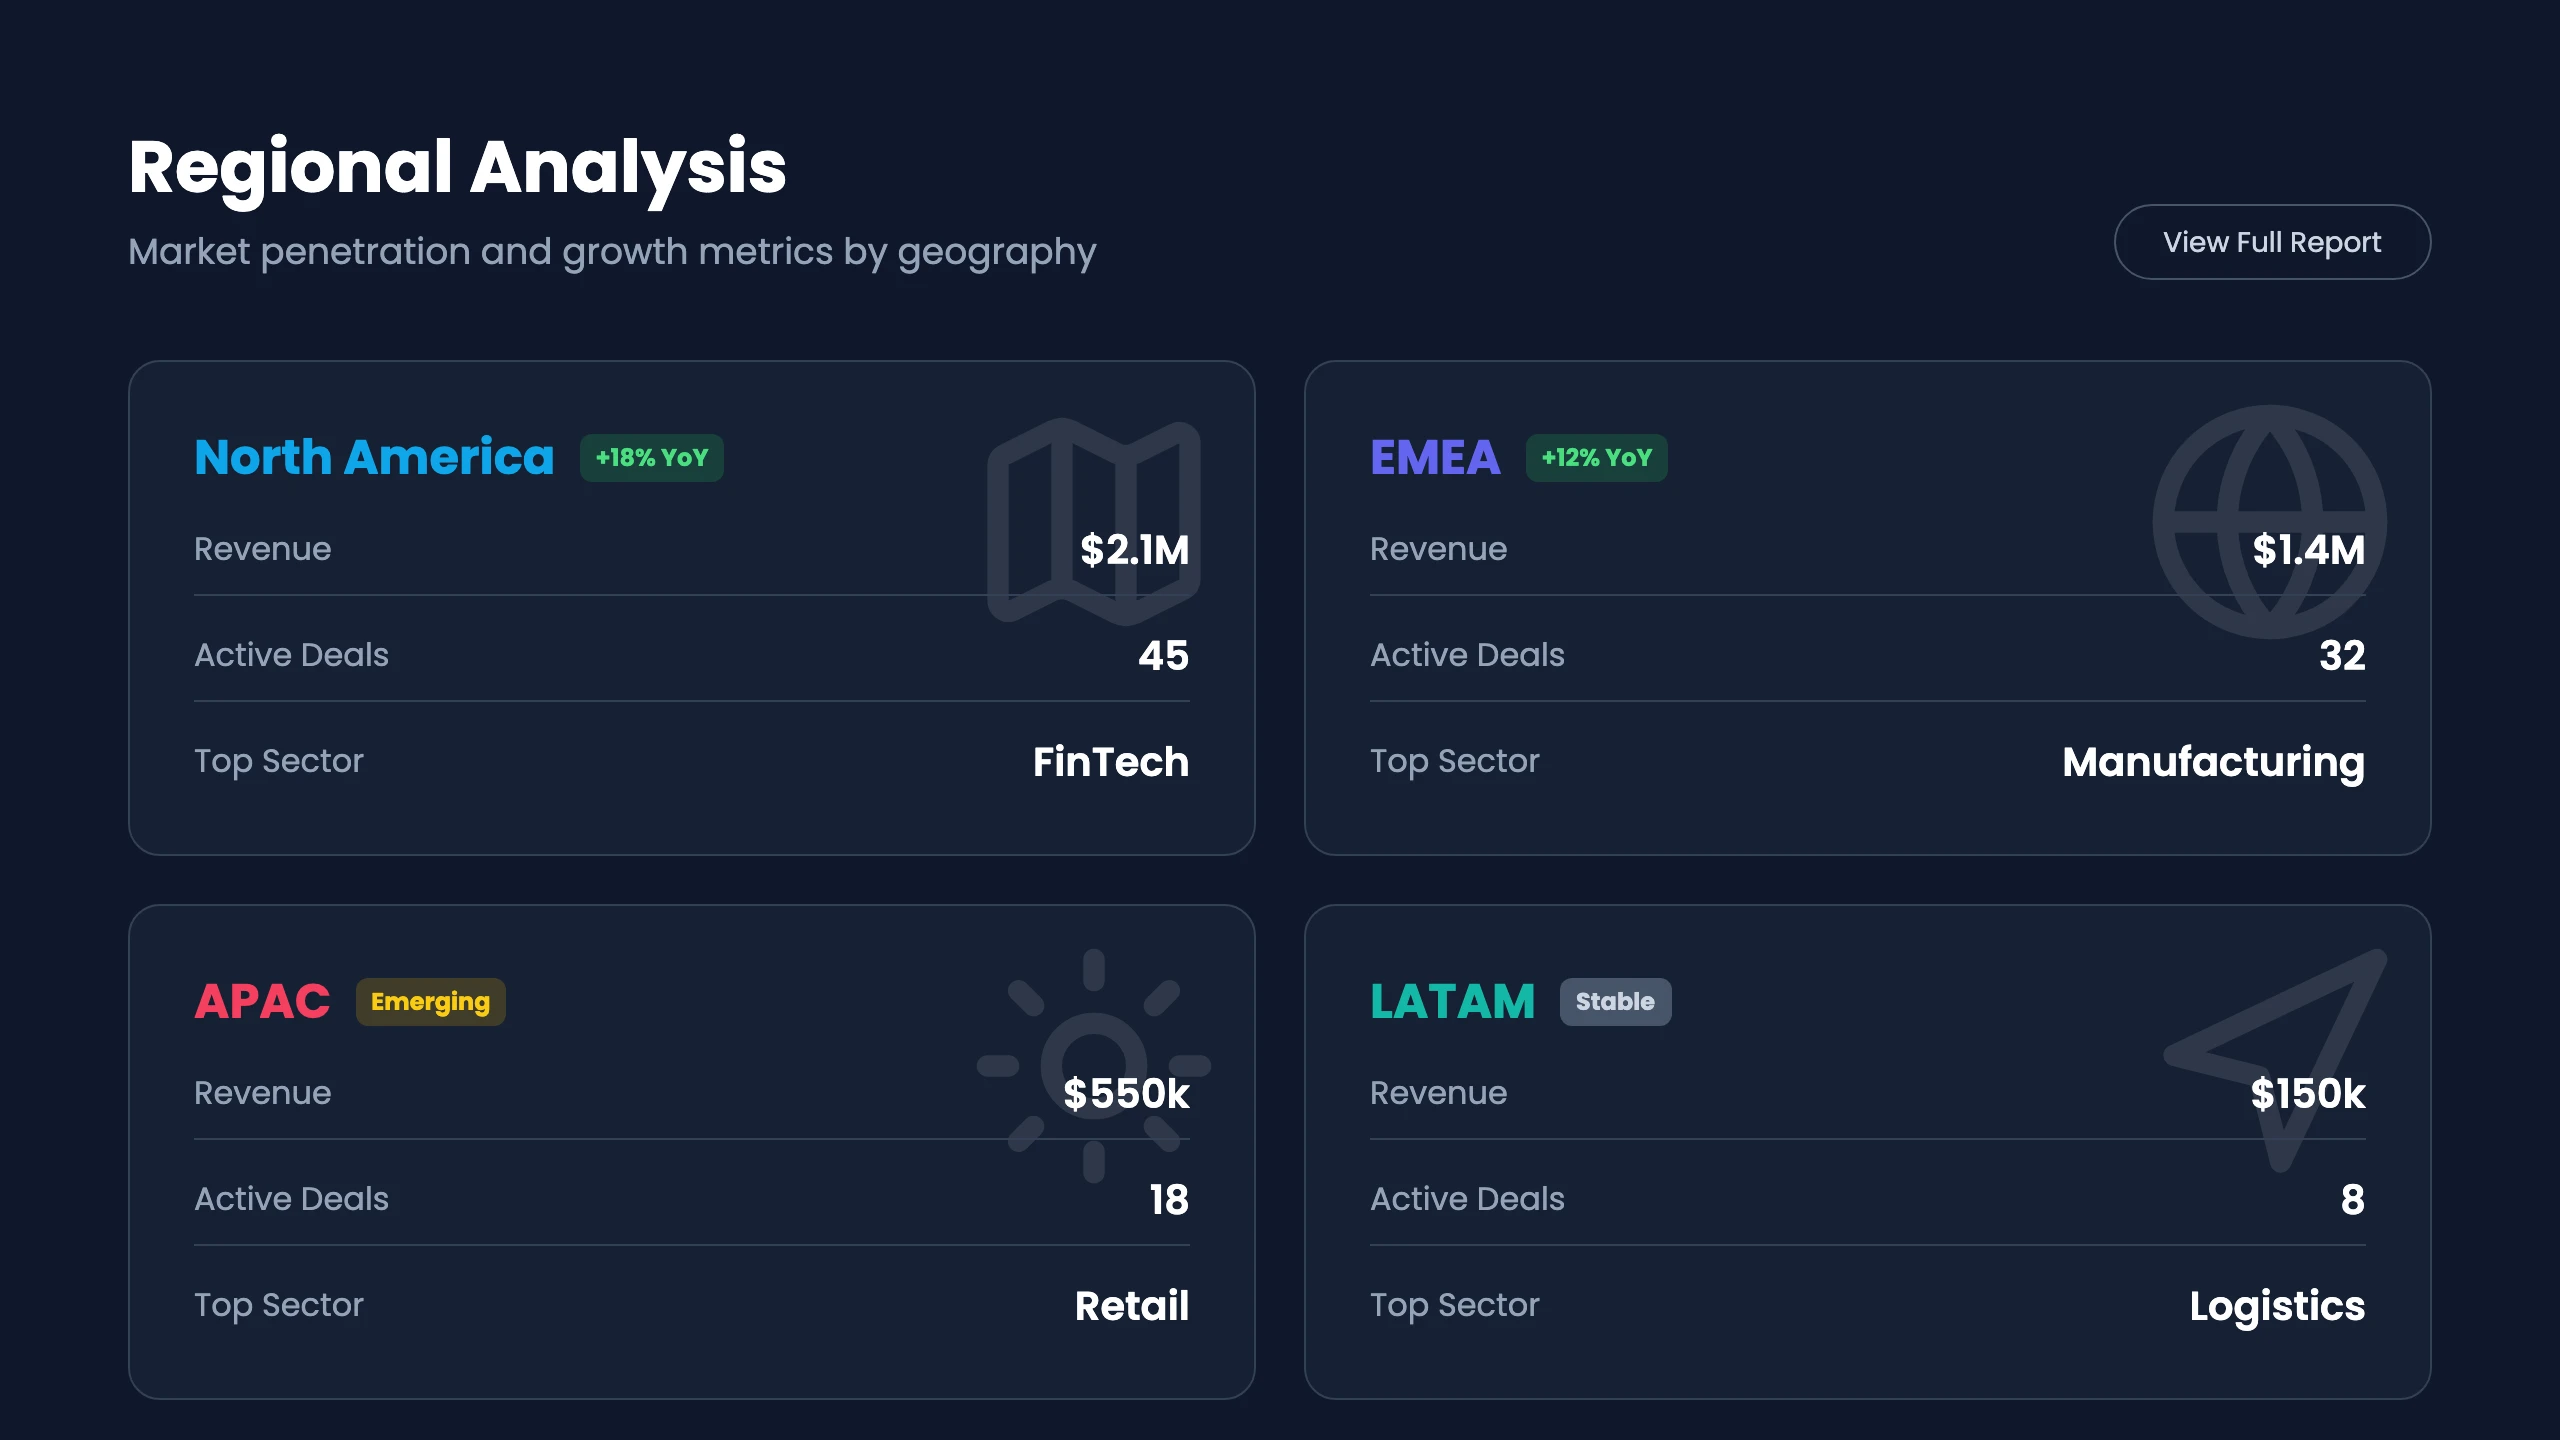
6. Regional Analysis
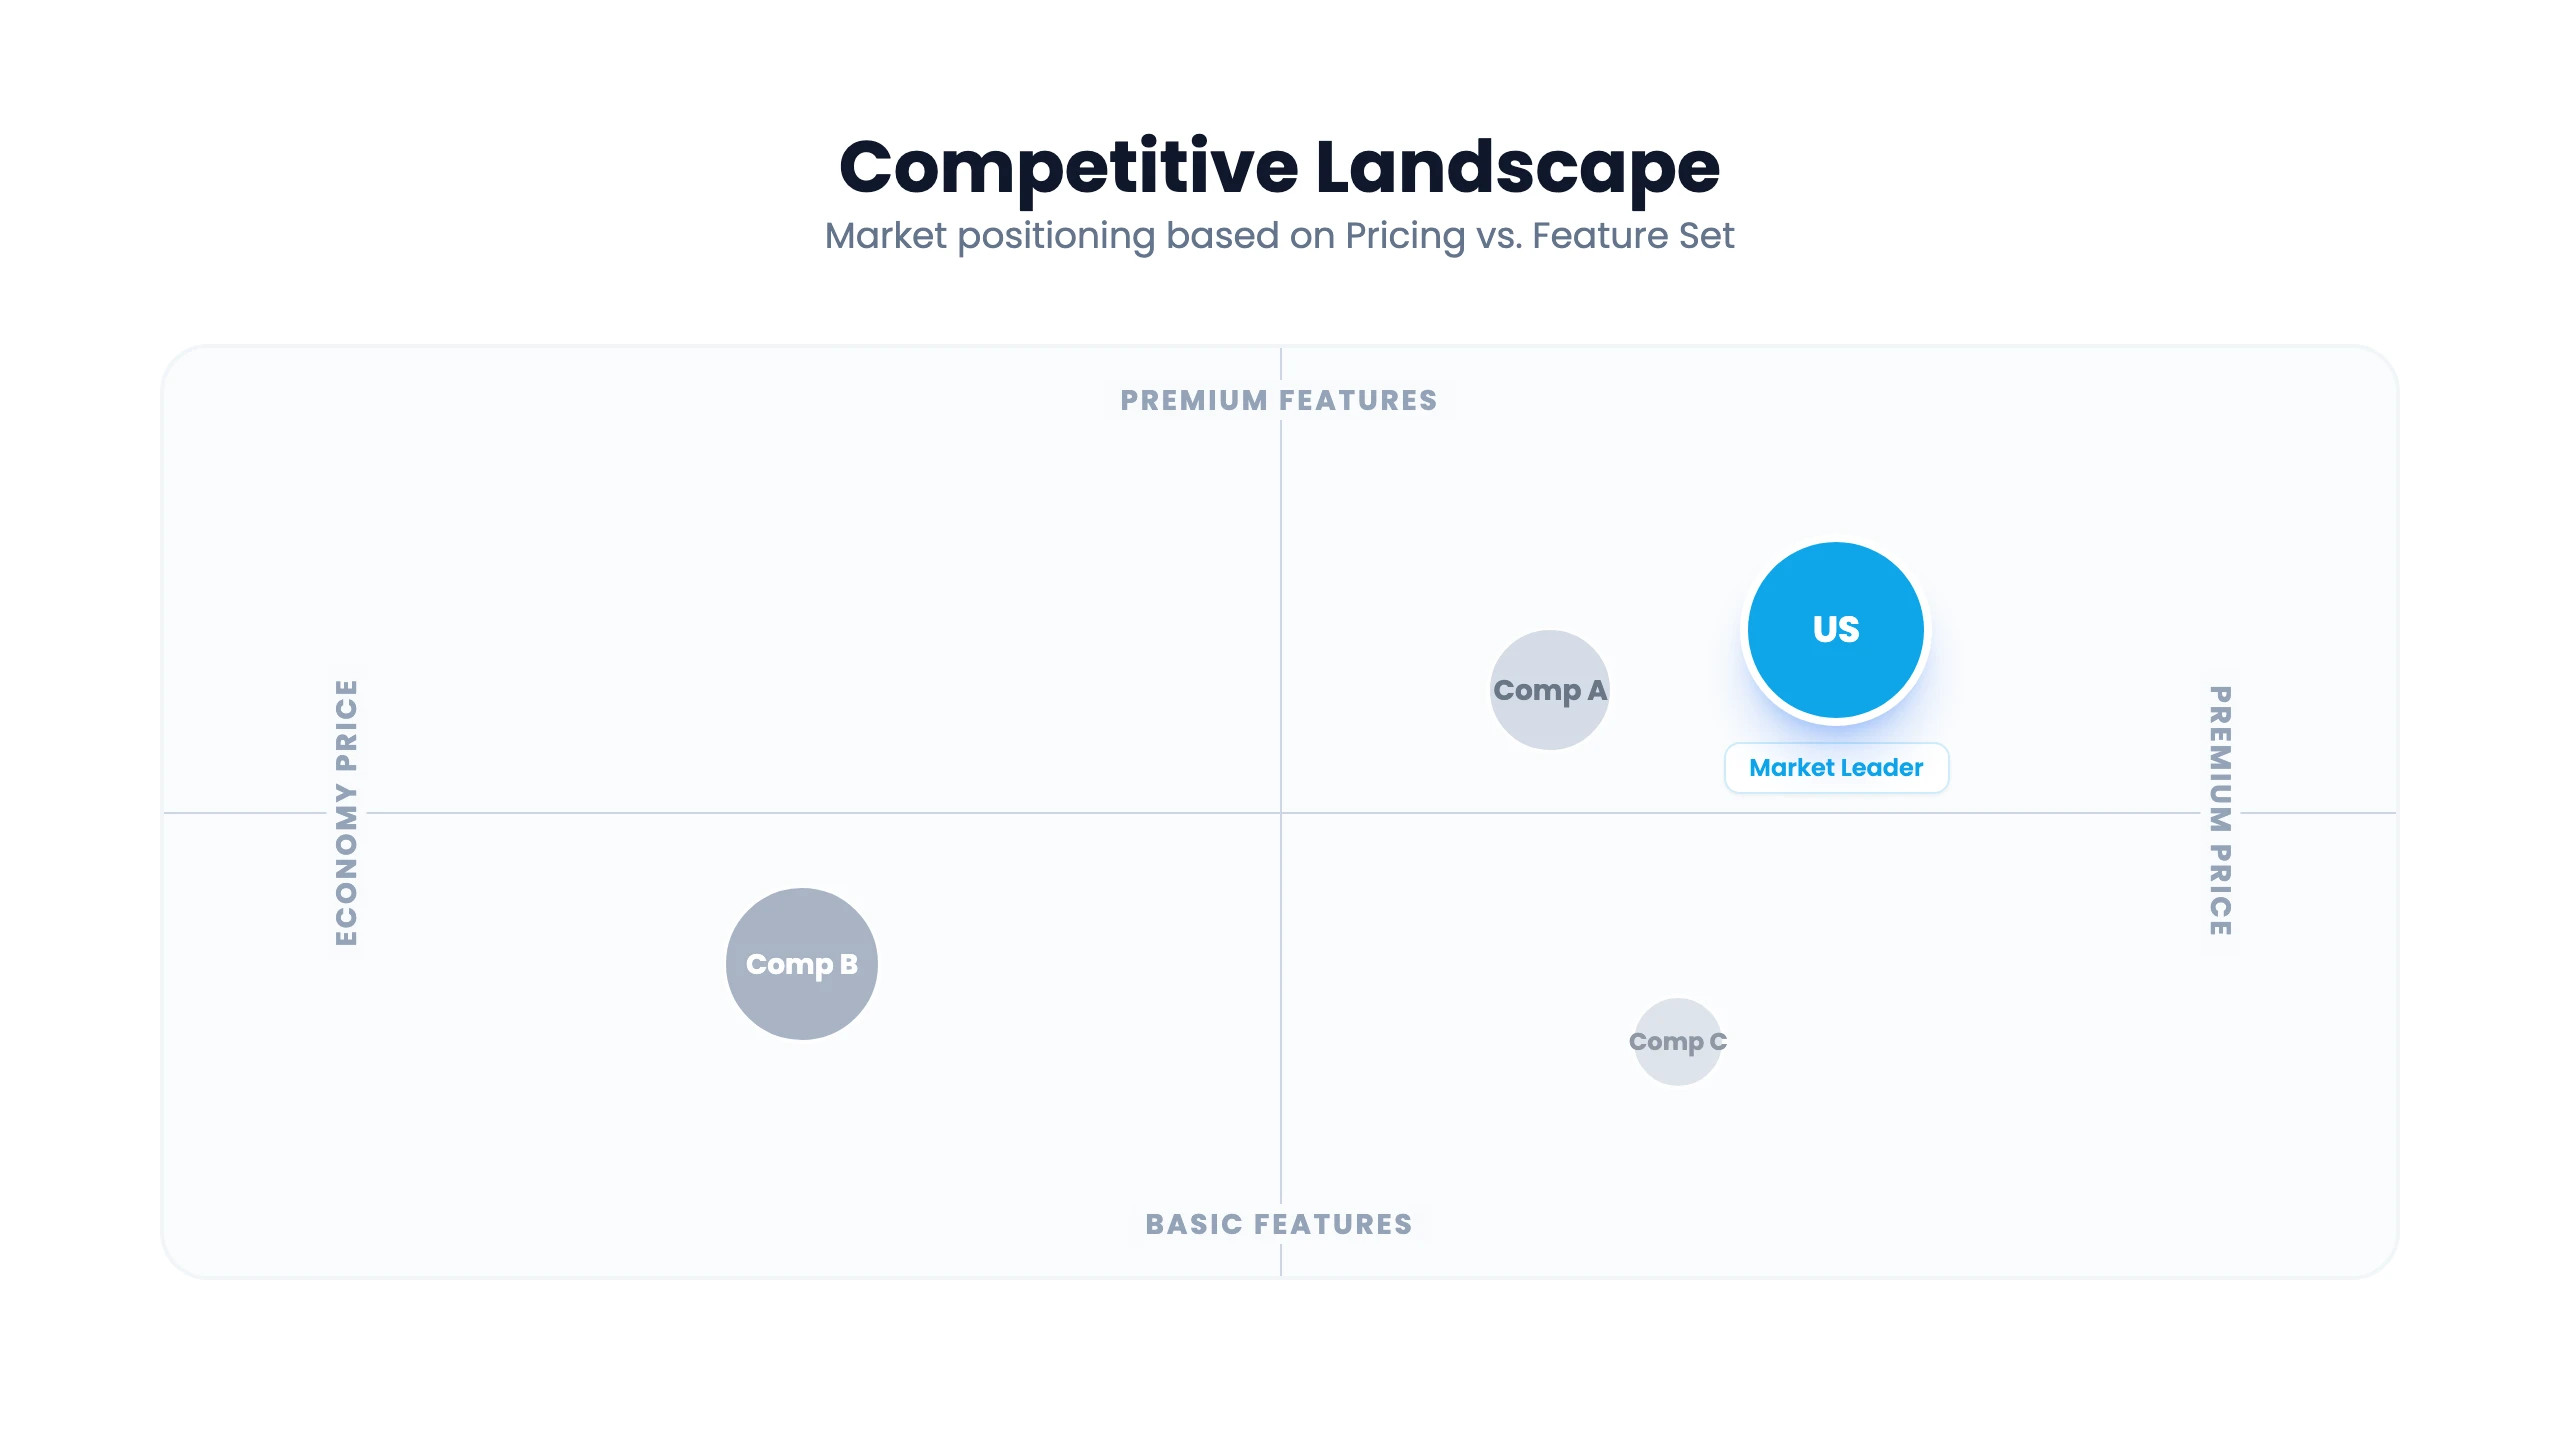
7. Competitive Landscape
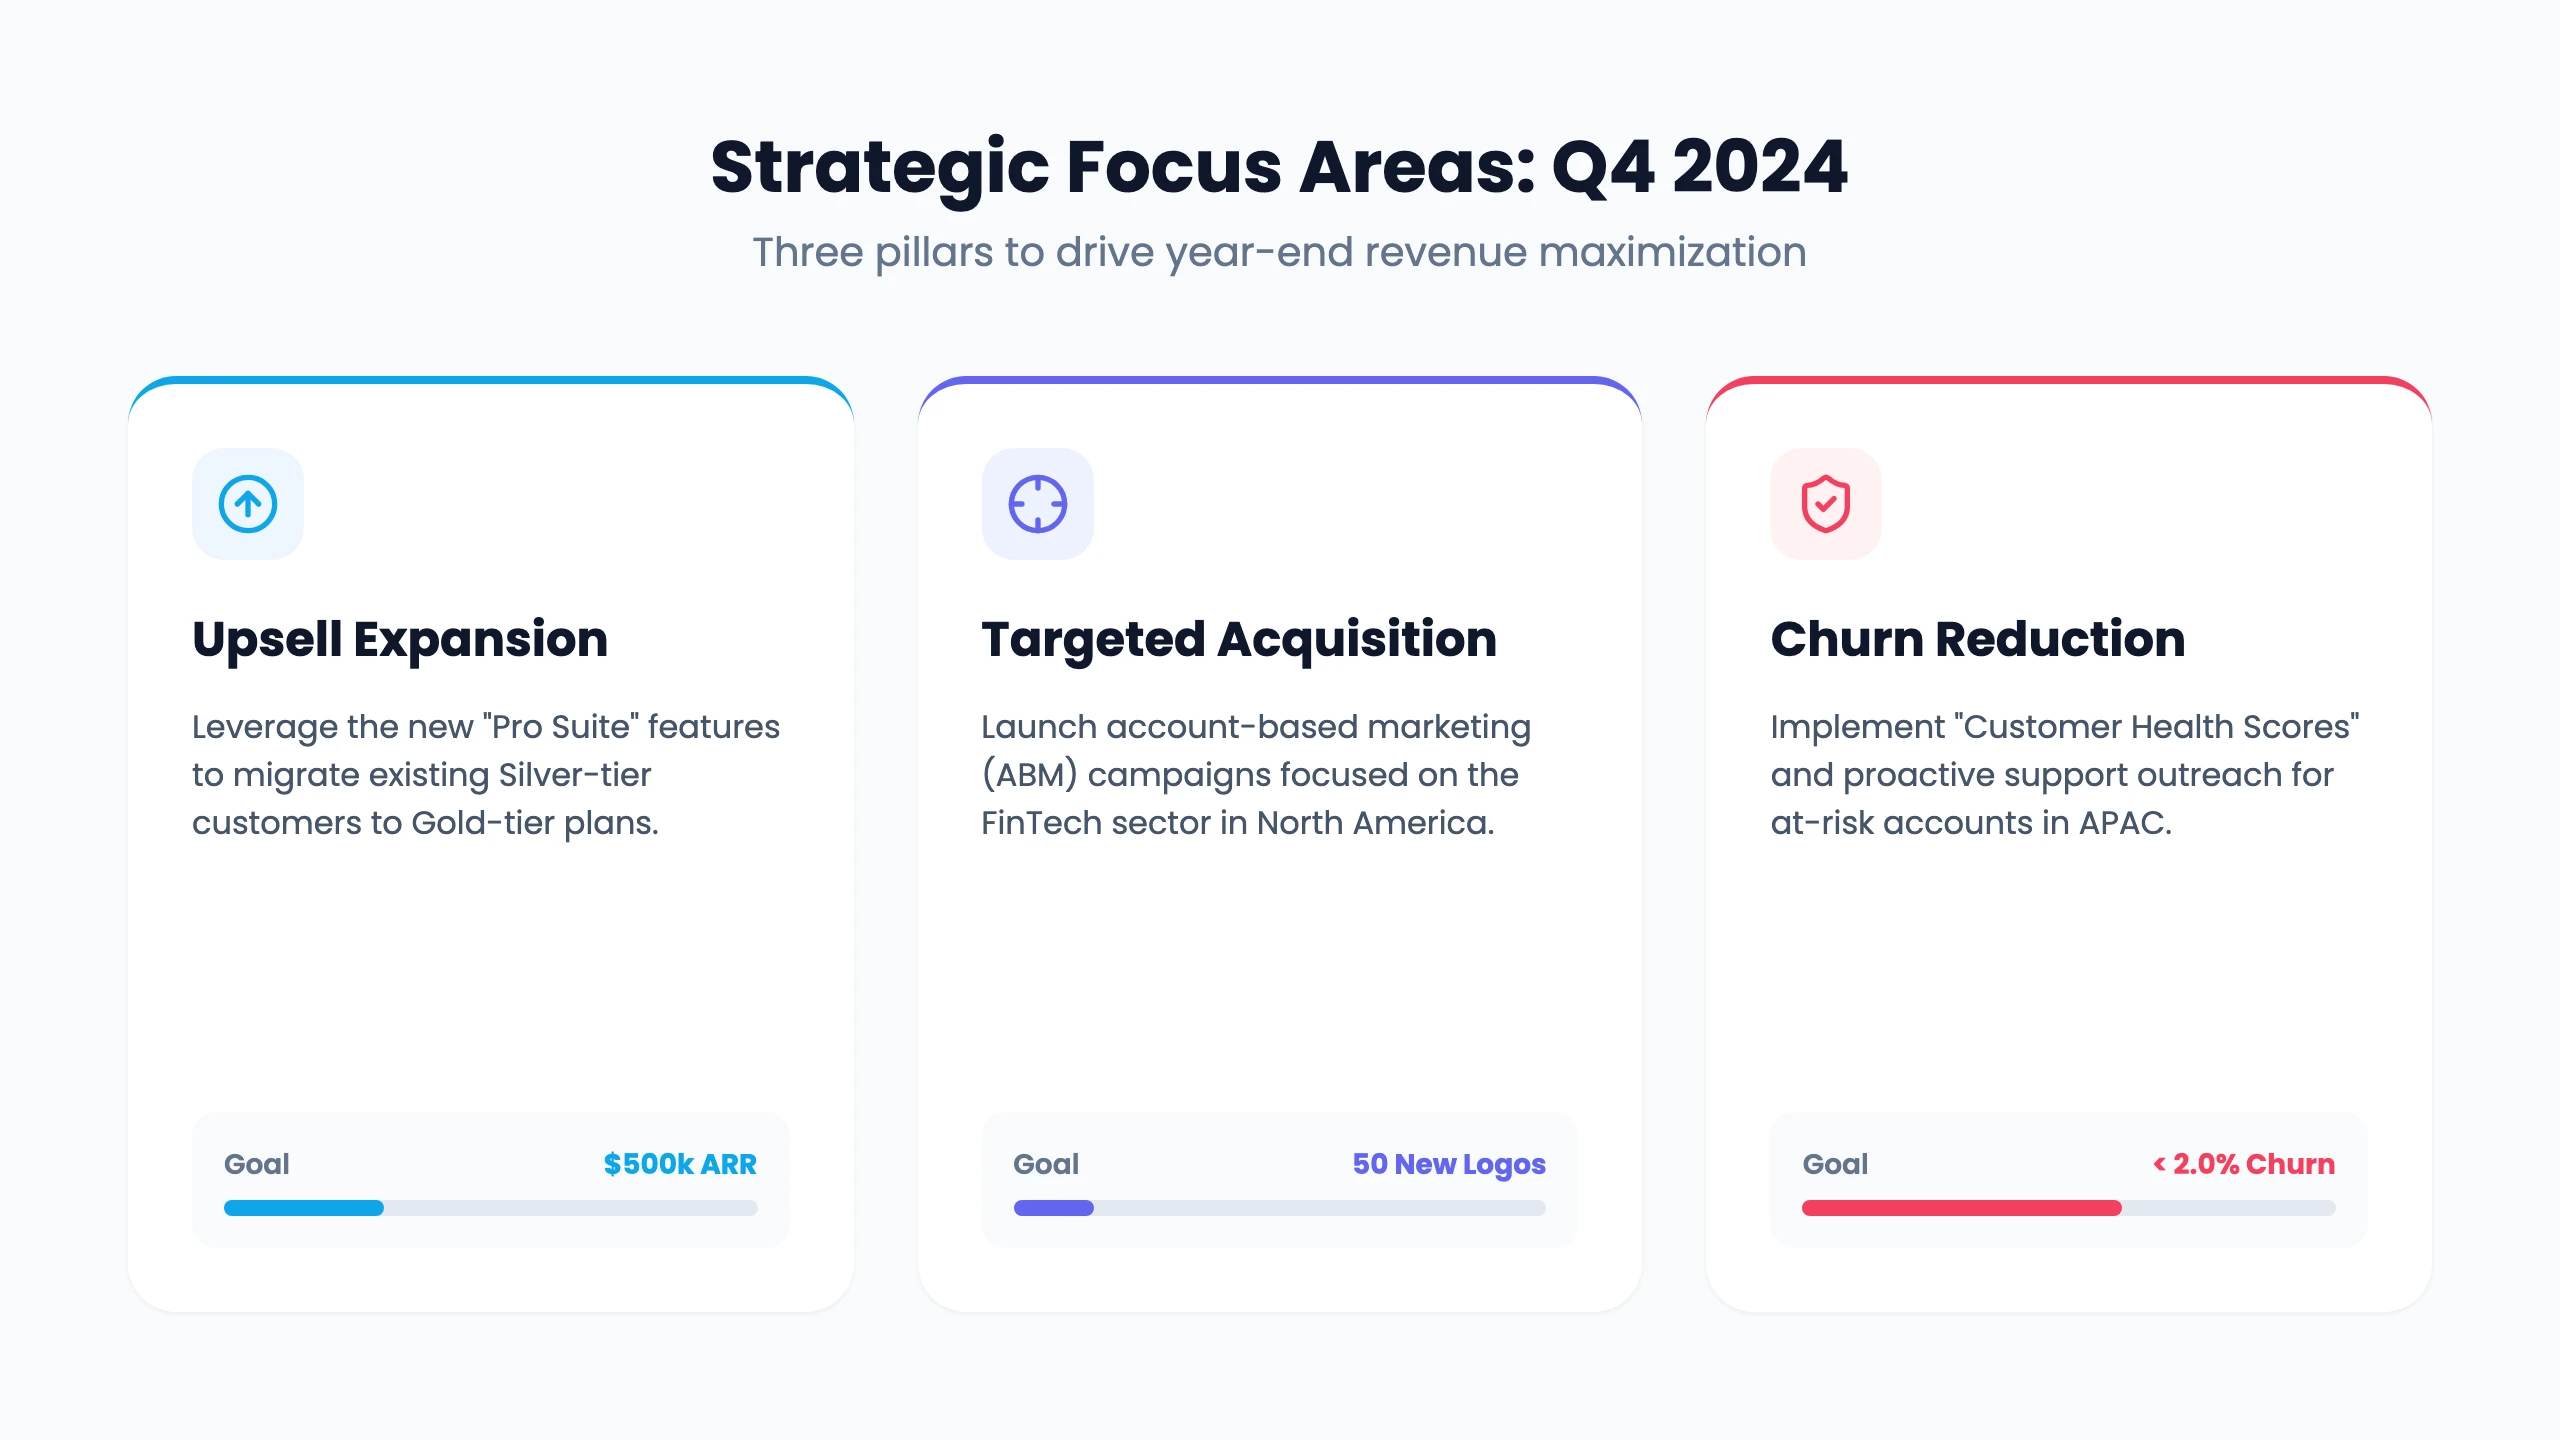
8. Next Steps
Revenue data
The three-month actual revenue totals $4,200,000. Values below reproduce the sample chart.
| Month | Actual | Target |
|---|---|---|
| July | $1,250,000 | $1,200,000 |
| August | $1,380,000 | $1,300,000 |
| September | $1,570,000 | $1,450,000 |
About this preview
High-resolution static previews of a sample template—not customer work or a recorded Cue execution. The high-resolution version of slide 2 replaces the external photograph with a schematic using the template’s illustrative figures: 15% growth in enterprise deals, 22% growth in average contract value and 2.8% APAC churn. Other clarity edits cover the background on slide 1, chart tick precision, one icon and a short label.
Original template source. These previews can be browsed independently of the original viewer. “View Full Report” on slide 6 is static artwork, not a button; use the page links above to browse. This page provides no editable presentation download or one-click generation.
High-resolution render: 2026-10-09 11:47 UTC+08:00 · Derivative: review-derivative-v2.